Comparing Volatilities: Implied vs Realized (VRP)
Objectives
- Frame implied-versus-realized as the Variance Risk Premium VRP = σ_IV² − σ_RV², measured as a time series.
- Explain the VRP economically as a variance/jump risk premium — compensation for bearing crash risk, not a free lunch — and why it is naturally a variance object.
- Apply a one-sample t-test to the VRP series, and switch to a sign test or block bootstrap when its fat tails and autocorrelation break the t-test.
- Explain why harvesting the VRP carries negative skew, so statistical significance is necessary but not sufficient to trade it.
Two volatilities can disagree, and the disagreement is where the money is. The market gives you two numbers for the same asset over the same horizon. The implied volatility is the volatility the options market is pricing right now, backed out of option premiums — a forecast, a crowd putting capital behind its view of how much the asset will move. The realized volatility is what the asset actually delivered, measured from its returns after the fact — a record of the past (the estimators of 102 ch4). One is a promise about the future; the other is the receipt. When the promise consistently exceeds the receipt, someone has been overpaying, and someone else collecting. This chapter is about measuring that gap rigorously — and, just as importantly, understanding what it is.
Forecast versus record
Implied vol is the market's forecast of future realized vol — and the single best forecast available, because it aggregates everyone's information and capital. But it is a biased forecast: it sits systematically above the realized vol that follows. That bias is not a mistake the market keeps making; it is a price. Understanding why is the difference between seeing a number that's "usually positive" and seeing a risk premium.
Why the gap exists: the variance risk premium
Here is the economics the statistics can't give you. Selling options — being short volatility — exposes you to large losses precisely when markets crash: exactly the moments when your other holdings are also falling and cash is most precious. Bearing that risk is unpleasant in a specific, correlated-with-disaster way, so risk-averse investors demand compensation to do it, and hedgers willingly overpay for crash insurance. The option price therefore embeds a premium above the actuarially fair (expected-realized) level. That premium is the volatility risk premium, and it is one of the most robust facts in all of options: implied exceeds realized, on average, across most assets and most of the time.
The crucial reframing: this is not a free lunch or a market inefficiency. It is the market paying you to bear a genuine, nasty risk — the financial equivalent of an insurance company's underwriting profit. You earn it steadily and pay it back violently.
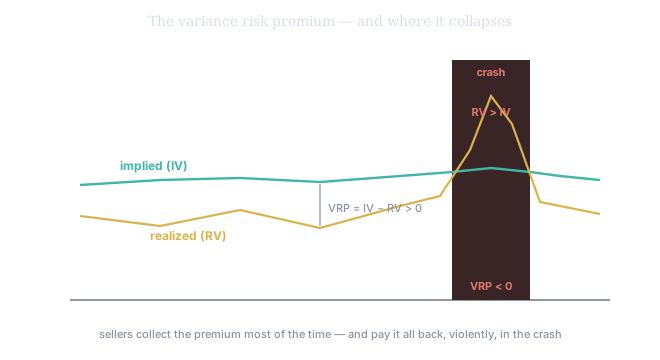
Figure 1. Implied (teal) sits above realized (gold) through normal times — that gap is the premium sellers harvest. But in the crash, realized spikes above implied and the premium goes sharply negative: the seller pays back months of pennies in a single session. The premium and its collapse are the same phenomenon seen in calm and in crisis.
Why variance, not volatility
We write the premium in variance units, , and that is not arbitrary. The clean instrument for trading this gap is the variance swap — a forward contract that pays the difference between realized variance and a fixed strike, where the fair strike is the market's implied variance. As Gatheral puts it, a variance swap is "a pure play on realized volatility": no option-by-option hedging, just the variance difference. Because the directly-tradeable object pays in variance, the premium naturally lives in variance, and is the quantity a variance-swap seller actually banks.
Implied is not a sample
Now the statistics — and the first thing to get right is what kind of object each number is, because it rules out the test a careless reader reaches for first. Realized volatility is an estimate from a sample of returns: sixty daily moves, squared, averaged, annualized, with its own degrees of freedom and sampling wobble. Implied volatility is not a sample of anything — it is a single price-implied point, one number quoted now, with no return series and no degrees of freedom inside it. That asymmetry kills the two-sample F-test for equality of variances that the textbook reflex suggests: you do not have two samples of returns to put on the two arms of an F-ratio. Implied is a benchmark, not a sample.
VRP as a time series, and the t-test
The correct move is to stop comparing two static numbers and study a single series through time. Each day the market quotes an implied variance and the asset eventually delivers a realized variance; take their difference and you get one day's VRP — as noisy as any single estimate. But do it every day for months and you have a time series of VRP, a genuine sample with as many observations as days. Now a statistician has something to test. The clean question: is VRP reliably positive over time? The tool is the one-sample test of ch3, with null "the true mean VRP is zero":
A far in the tail rejects "no premium," and you have a statistically defensible edge rather than a hopeful one — you are asking whether the premium persists, not whether it happened to be positive last Tuesday.
The honest caveats
The t-test leans on the VRP series being roughly normal with independent observations, and it is neither. It has fat tails — the occasional vol blow-up drives VRP sharply negative — and it is strongly autocorrelated, because today's implied and realized variance resemble yesterday's. Both inflate your confidence, through different channels. The autocorrelation and overlapping windows make the naive standard error too small: your effective sample is far smaller than the raw day count, so overstates how much independent information you have. The fat tails do something separate: they break the t-distribution approximation itself, so even with the right SE the stated p-value understates the true tail probability. Either way the plain t-test manufactures significance that isn't there — handing you a confident number while quietly lying.
The robust escapes
The escapes are the sign test and the bootstrap. The sign test throws away magnitudes and asks the simplest version: on what fraction of days was VRP positive at all? Under "no premium" you'd expect about half; a count far above half, judged against the binomial, is evidence — with no normality assumption anywhere. The bootstrap goes further: resample the VRP series thousands of times, recompute the mean each time, and read the interval off the empirical distribution, so it inherits whatever fat tails and skew your real series carries. A block bootstrap — resampling short runs of consecutive days — also respects the autocorrelation the t-test ignored. In every case you let the real series speak instead of trusting a formula that assumes it is something it is not.
The hidden skew of harvesting it
One last lesson, and it is where statistics meets survival. Suppose your tests all agree: the VRP is reliably, significantly positive. Does that make selling volatility a good trade? Not by itself. Harvesting the VRP means being systematically short volatility, and that payoff has a shape you already know.
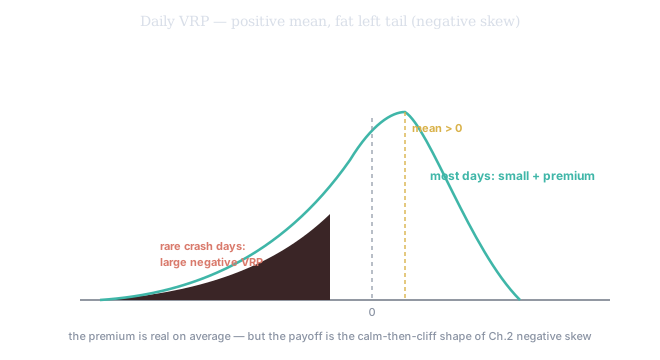
Figure 2. The distribution of daily VRP: most days a small positive premium, but a long, fat left tail of rare large-negative crash days. The mean is genuinely above zero — yet the payoff is the calm-then-cliff, negatively-skewed profile from Tier 100 ch2.
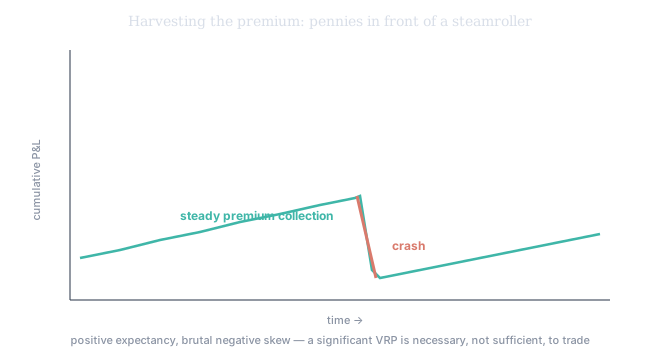
Figure 3. The same fact as an equity curve: a steady grind upward collecting premium, punctuated by a cliff when realized blows through implied. This is "picking up pennies in front of a steamroller." The expectancy (ch4 of Tier 100) is positive; the risk is in the tail the average hides.
So a significant positive VRP is necessary but not sufficient to trade. The verdict on persistence is a statistics question; the decision to take the position is a risk-sizing question — how large a steamroller can you survive? This is exactly why a positive VRP, in practice, is never traded raw but paired with a tail-risk budget.
Application: SVQ's Variance Risk Premium
This is the engine under SVQ's Variance Risk Premium. SVQ computes every day, building the time series you just learned to test, and the genuinely useful signal is not any single day's gap but whether the mean of that series is statistically distinguishable from zero — a t-statistic far in the tail, a sign-test count well above half, or a bootstrap interval excluding zero (overlap-corrected, because the series is autocorrelated). When SVQ flags a VRP as significant, it is telling you the premium persists. And note where that signal goes: into the TEP Engine's trade proposals, paired with CVaR and tempered-Kelly sizing — because SVQ treats the VRP exactly as this chapter does, as a risk premium to size against the tail, never as a free edge to press.