Reading Saqrid's Output Honestly
Objectives
- Integrate returns, distribution, spread, base rates, and estimation uncertainty into a single five-gate reading of any output.
- State what a p-value is and the three things it is NOT, and connect the misreading to the confusion of the inverse.
- Recognize the manufactured-number traps: confounding, overfitting/backtest illusion, microstructure artifacts, survivorship and look-ahead bias, and Goodhart's law.
- Apply a repeatable honest-reading checklist before acting on any Saqrid signal.
At the very start of this course, before you knew any of the machinery, you were asked a question and told to hold onto your answer: what does it mean to say a number on the screen is evidence? It is time to answer it properly, because you now have everything you need — and your answer should be richer, and more skeptical, than the one you started with. This is the capstone: not a new idea, but the assembly of all five into a single habit you can run in ninety seconds before any trade.
The five gates
Everything in this course has been building five separate ways of being fooled, and five corresponding ways of not being. Each chapter was, in disguise, one gate — and the five together form a checklist that any number must pass before you are entitled to call it evidence that an asset will move. Let's walk them in order, recapping what each module gave you and turning it into a question you ask the screen.
Gate 1 — Scale. (Module 1: Prices, Returns, and Log-Returns.) You learned that a price tells you nothing — the change carries the information — and that returns have two traps: simple returns are asymmetric (a −50% loss needs a +100% gain to recover) and they don't add across time. The fix was the log-return, , which adds across time and treats up and down symmetrically, which is why SV computes in log space. The gate: is this number living in the right space? Fails when: a "50% bounce" computed in raw arithmetic space looks bigger than the 33% drop it actually reversed. Know which scale you stand on before reading anything built on top of it.
Gate 2 — Shape. (Module 2: The Real Shape of Returns.) You learned that the whole pile of returns is a distribution, summarized by four moments — mean, variance, skewness, and kurtosis — and that the seductive bell curve lies in two ways: returns have fat tails (positive excess kurtosis, — extremes far more common than Normal predicts) and they are often negatively skewed (grind up, crash down). You learned to see this with a QQ-plot. The gate: does the tidy summary hide the distribution underneath it? A mean conceals skew; a volatility quoted under a bell-curve assumption conceals fat tails. Fails when: a calm-looking number sits on a return distribution that is a long quiet grind ending in a cliff — the risk lives exactly in the part the summary erased.
Gate 3 — Spread. (Module 3: Center and Spread.) You learned that risk lives in the scatter, measured by variance and its square root, the standard deviation — which in finance is volatility. You learned to annualize it with the √time rule (), that this rule quietly assumes returns are i.i.d. (they aren't — volatility clusters), that the robust MAD can disagree with the ordinary standard deviation when tails are fat, and that for pairs of assets correlation governs real risk. The gate: is something treating spread as constant when you know it clusters? Fails when: a risk limit calibrated in a placid stretch blows through exactly when turbulence arrives in clumps.
Gate 4 — Base rate. (Module 4: Randomness and the Base-Rate Trap.) You learned that a pure random walk manufactures convincing "support" and "trends," so the burden of proof is on any claim of signal over noise. The cure was probability: conditional probability, the warning that , and Bayes' theorem, which combines the base rate (the prior) with the evidence — and showed that a 90%-accurate test for a rare event is right only ~8% of the time. You also met data-snooping, the Law of Large Numbers, and expectancy (hit rate × payoff). The gate: strip the signal away — what was going to happen anyway? Fails when: a "70% accurate" buy signal sits on an asset that rises 65% of weeks regardless; a pattern that merely matches the base rate is noise that learned to dress well.
Gate 5 — Uncertainty. (Module 5: Sampling and Estimation.) You learned that every number is an estimate of a true parameter, drawn from a sampling distribution whose spread is the standard error — which shrinks only like . The Central Limit Theorem is why we can wrap a Normal-based error bar around an estimate even when returns are fat-tailed, and that error bar is the confidence interval (with the crucial caveat that the 95% describes the procedure, not your one interval). You also met the bias–variance tradeoff behind the lookback-window choice. The gate: how wide is the error bar? Fails when: "volatility is 22%" hides an unstated interval of 14–30 — a number without its uncertainty is half a sentence.
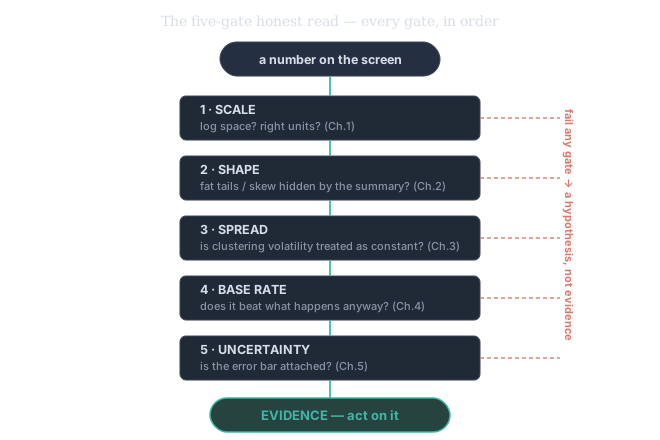
Figure 1. The honest read as a flow. A number must pass all five gates, in order, to earn the word "evidence." Fail any one and it drops to the right — not false, but unproven: a hypothesis you have not yet earned the right to believe. The whole discipline of this institute is the refusal to confuse the second thing for the first.
So the opening question answers itself. A number is evidence that an asset will move only when it survives all five gates at once: correctly scaled, honest about its shape, aware its spread can change, measured against the base rate, and reported with its uncertainty. A figure that clears every gate you can act on with a straight face. A figure that fails even one is, at best, a hypothesis.
Beyond the gates: when the number itself is fake
The five gates assume one thing: that the number was honestly measured in the first place. But some numbers are corrupted before any statistic runs — the data, the test, or the search that produced them is rigged, usually without anyone intending it. These are the named traps, and a professional knows them on sight.
What a p-value is — and the three things it is not
Soon (in Tier 200) you will replace Gate 4's eyeball with a real p-value. The honest definition: if the signal were truly worthless, how often would pure luck produce a result at least this good? That probability is the p-value. Small means luck rarely does this — evidence the effect is real. It is genuinely useful. But it is misread constantly, in exactly three ways:
- A p-value is not the probability the signal is worthless. It is , not . Swapping those is the confusion of the inverse from Chapter 4 — the prosecutor's fallacy wearing a lab coat. To get the thing you actually want, the probability the effect is real, you need the base rate (the prior) and Bayes, not the p-value alone.
- A large p-value is not proof the signal works. It can mean the signal is worthless, or that your test was too weak to detect a real effect — too little data, too much noise. Absence of evidence isn't evidence of absence.
- "Statistically significant" is not "big enough to trade." With enough data, a microscopic, useless edge becomes "significant." Significance answers is it real?; it never answers is it large enough to matter? Those are different gates.
Correlation is not causation
Two series moving together — correlation — does not mean one drives the other. A hidden third factor (a confounder) can move both: two stocks look "linked" only because both ride the same sector or the same macro tide. Trade the correlation as if it were a causal lever and it dissolves the moment the confounder shifts. Before acting on a relationship, always ask: what unmeasured thing could be driving both?
The backtest illusion: overfitting
This is the most expensive trap in quantitative trading. Give a flexible enough rule enough free parameters and it will fit any past data perfectly — including the noise. It looks spectacular on the history it was tuned on, and falls apart the instant real money meets new data.
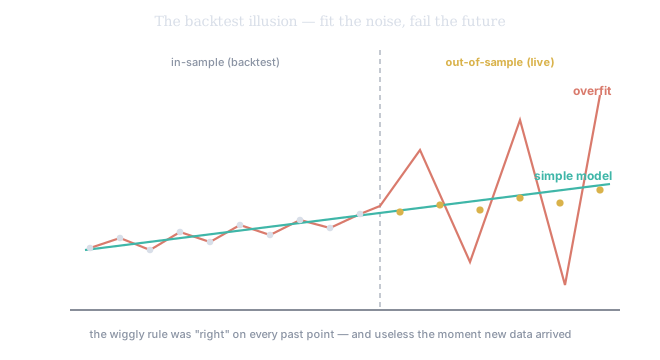
Figure 2. The wiggly red rule threads every in-sample point — a flawless backtest. The simple teal model fits the past only loosely. But out-of-sample (the gold points, the future), the simple model tracks reality while the overfit rule flies off into nonsense. It learned the noise, not the signal. This is Chapter 4's data-snooping seen from the other side: the cure is to judge a rule only on data it never saw while being built — out-of-sample — and to stay suspicious of any backtest that looks too good.
Microstructure artifacts: the measuring instrument talking
Sometimes a number is real but means nothing, because it's an artifact of how prices are recorded, not of the market. On fine timescales, the bid–ask bounce — price ping-ponging between the bid and the ask on consecutive trades — manufactures spurious negative autocorrelation and inflates volatility estimates, with no predictive content at all. Nonsynchronous trading — one asset's last print being minutes stale relative to another's — fabricates lead–lag "relationships" that are pure timing illusion. Ignoring the overnight gap between close and open can badly bias a volatility figure. The lesson: before you believe a high-frequency signal, ask whether you're seeing the market or the plumbing.
Survivorship, look-ahead, and Goodhart
Three more, briefly, because they recur everywhere. Survivorship bias: backtest a strategy on the stocks that exist today and you've quietly excluded everything that went to zero — your universe is rigged to look profitable. Look-ahead bias: using information in a backtest that wouldn't have been available at the time (a restated earnings number, a same-day close to trade the open) inflates results with data from the future. And Goodhart's law: once a genuine edge becomes widely known, it gets crowded and arbitraged away — "when a measure becomes a target, it ceases to be a good measure." The edge that worked in the paper stops working once everyone reads the paper.
The honest read, in practice
None of this is reason for paralysis — it is reason for a routine. When SVQ shows you a volatility spike or SV's HV(P&R) flashes a regime change, the discipline is mechanical: scale (log?), shape (fat-tailed context?), spread (clustering?), base rate (vs. what anyway?), uncertainty (how wide the SE band?). Then the second pass: is this measured honestly — not a bid–ask artifact, not an overfit backtest, not a survivorship mirage? A number that clears both passes is a number you can size a position around. Most don't, and knowing that before you act is the entire return on this course.
Notice what the five gates still are: qualitative. You're answering by judgment. That is exactly the right place to end the foundations — and exactly where the next tier begins. In Tier 200 the gates go quantitative: "does it beat the base rate?" becomes a hypothesis test with a real probability; "is this related to that?" becomes a regression with an uncertainty-bounded coefficient; "is the backtest real?" becomes out-of-sample validation. The questions don't change. You just stop guessing the answers and start computing them.
Every output a trader genuinely relies on inside Saqrid — a signal, a volatility, a correlation — passes through the same routine: the five gates (scale, shape, spread, base rate, uncertainty), then the artifact pass (p-value misread? confounded? overfit? microstructure? survivorship?). The honest verdict at the end is one word: evidence, or hypothesis? This is the single most valuable habit this course can give, and it costs about ninety seconds.