Regime Detection: BOCPD, Hurst & Bubble Tests
Objectives
- Explain Bayesian Online Changepoint Detection in terms of run-length, the hazard rate, and the posterior over how long the current regime has lasted.
- Estimate and interpret the Hurst exponent via Detrended Fluctuation Analysis, distinguishing mean-reverting, random, and trending regimes.
- Read the GSADF bubble test, knowing what its supremum-of-statistics construction can and cannot tell you about explosive price behavior.
A market does not hold still long enough to be one thing.
For weeks it grinds in a range, every dip bought, every spike sold — and then, without asking permission, it becomes a different animal entirely: trending, explosive, indifferent to the levels that mattered yesterday. The single hardest judgment in cross-asset work is not measuring a number. It is knowing which world you are currently standing in, because the same number means opposite things in different worlds. A two-sigma move is noise in a ranging market and the opening of a breakout in a trending one. So before you can decide whether a number is genuine evidence an asset will move, you have to answer a prior question: what regime are we in, and has it just changed? That is what this chapter is about, and it is what the three engines inside SVNexus — BOCPD, the Hurst exponent, and the GSADF bubble test — exist to answer.
Start with the cleanest of the three idea: detecting the moment a regime changes. The intuition is almost human. Each day you ask, "given everything I have seen, how long has the current calm lasted?" If the world keeps behaving, your belief that the run is long grows day by day. The instant the data stops fitting the run you have been assuming, that belief collapses, and your sense of the run-length resets toward zero. Bayesian Online Changepoint Detection, or BOCPD, makes that intuition exact. It maintains, at every step, a full probability distribution over the run length — the number of periods since the last changepoint. That is the key object: not a yes-or-no flag, but a posterior over how long the current regime has survived.
Here is the machinery, stated carefully. Let the run length at time t be a hidden integer. At each step the run length either grows by one — the regime continues — or drops to zero — a changepoint occurs. The probability of a reset is governed by the hazard rate. If you believe changepoints arrive with constant probability, the hazard is a single constant, often written as one over the expected run length; a hazard of one-in-two-hundred-and-fifty says you expect a regime to last about a trading year. BOCPD then does two things every period. First, it predicts: each possible run length carries its own little model of the data — typically a Gaussian whose mean and variance were learned only from the points inside that run — and it asks how well the newest observation fits. Second, it updates: it multiplies that predictive fit by the prior on each run length, spreads probability mass forward for "regime continued" and dumps mass onto zero for "regime reset," and renormalizes. The output is a recursively updated joint distribution over run length and data, computed online — no looking back, no refitting the whole history. When most of the posterior mass suddenly piles up at a run length near zero, BOCPD is telling you a changepoint just fired.
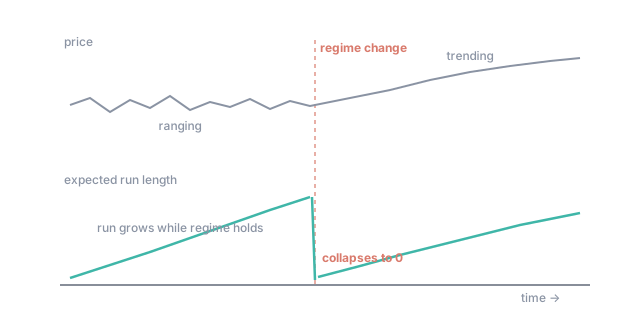
Figure 1. While the regime holds, the expected run length climbs steadily — each day adds one to "how long has this lasted." The instant the data stops fitting the run, the posterior collapses to zero: that reset is the changepoint, lined up here with price breaking from ranging into trending.
What BOCPD does not tell you is the character of the regime you have entered. For that, turn to the Hurst exponent, which measures the memory in a series — whether moves tend to persist or to reverse. A Hurst exponent of one-half is the memoryless random walk: the past tells you nothing about the sign of the next move. Below one-half, the series is mean-reverting or anti-persistent — an up-move makes a down-move more likely, the signature of a ranging market where fading extremes pays. Above one-half, the series is persistent or trending — moves beget more moves in the same direction, the signature of a regime where momentum is real and breakouts follow through.
SVNexus estimates Hurst by Detrended Fluctuation Analysis, DFA, and it uses DFA on purpose, because the older rescaled-range method is fragile to the slow drifts and non-stationarity that pervade real prices. DFA proceeds in stages. You take the cumulative sum of the de-meaned series, turning returns into a profile, a kind of integrated random walk. You then cut that profile into non-overlapping windows of length n, fit and subtract a local polynomial trend inside each window — that detrending is the whole point, it strips out the slow wander that would otherwise contaminate the estimate — and measure the root-mean-square of what remains. That gives you a fluctuation, call it F of n. Repeat across a range of window sizes. For a self-similar process, F of n grows like n raised to a power, and that power is the Hurst exponent. So you plot the log of the fluctuation against the log of the window size, fit a straight line, and read the slope. The slope is your Hurst exponent. Clean, robust, and honest about its uncertainty.
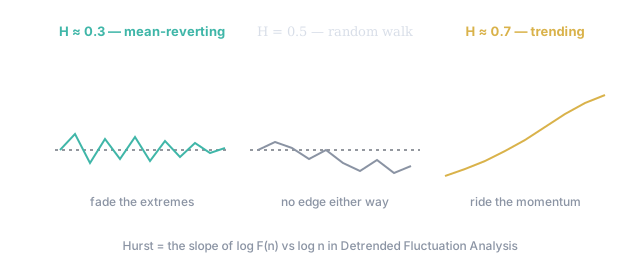
Figure 2. The three worlds the Hurst exponent distinguishes. Below 0.5 the path is anti-persistent — it keeps snapping back to its level, so fading extremes pays. At 0.5 it is a memoryless random walk. Above 0.5 it is persistent — moves beget moves, so momentum and breakouts follow through.
The third engine asks a sharper question still: not "is this trending" but "is this explosive — is it a bubble?" A trend grows roughly linearly in log price — exponentially in the price level itself; a bubble grows exponentially too, but governed by an explosive engine rather than an ordinary one, the hallmark of a price feeding on itself. Statistically, a normal random-walk price has a unit root — an autoregressive coefficient of exactly one, the borderline that produces a flat-slope random walk; a bubble has an explosive root, an autoregressive coefficient greater than one, so the level compounds geometrically away from trend. The distinguishing signature is not the shape of the curve but that root crossing above unity. The classic Dickey-Fuller test checks for a unit root once, over the whole sample, and it is useless here, because a bubble that inflates and bursts inside the window averages out to nothing. The GSADF test — the Generalized Sup Augmented Dickey-Fuller test of Phillips, Shi, and Yu — fixes this by brute force in a principled way. It runs the right-tailed ADF test not once but over a great many subsamples, sliding both the start and the end point of the window across the data, and takes the supremum — the single largest test statistic over all those windows. Because it scans every flexible window, it can find an explosive episode that lives in only one stretch of the series, and by date-stamping which windows breach the critical value it tells you when the bubble was inflating. The critical values come from simulation, not a textbook table, because taking a supremum over many tests inflates the distribution — a subtlety worth respecting, since it is exactly why a naive single ADF over-rejects.
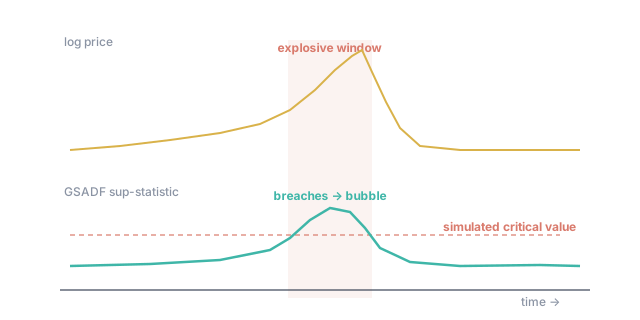
Figure 3. A price feeding on itself blows off and bursts (top). GSADF slides a right-tailed ADF test across every flexible window and takes the largest statistic; during the explosive stretch that sup-statistic punches above its simulated critical value (bottom) and date-stamps exactly when the bubble was inflating.
Three lenses, then, for one question. BOCPD tells you when the world changed. Hurst tells you what kind of world you are now in — mean-reverting, random, or trending. GSADF tells you whether that world has tipped into the dangerous, self-reinforcing explosivity of a bubble. None of them, on its own, is the trade. Together they are the context that decides whether the next number you see is noise or evidence.
The Regime panel in SVNexus, on any asset that ran hard this year, shows three readouts moving together. The BOCPD run-length posterior sits low and quiet while the regime holds, then collapses to near-zero on the day the character broke — that vertical reset is the changepoint. The Hurst gauge on either side of it often crosses the one-half line right around the reset, mean-reverting before, trending after, which is precisely why range tactics stopped working. The GSADF strip completes the picture: if it lit up — its sup-statistic punching above the simulated critical band — and date-stamped the explosive window, the asset was not in a trend but in a bubble, and the regime that follows a bubble is rarely the one that preceded it. Nexus publishes all three into the Bias Overlay that SV and SVQ consume, so the same regime verdict colors the signals shown elsewhere.